Cross Currents Home
Search:
Resources | About Us | 日本語サイト
Home Learn About Japan Learn About Japan-U.S. Cross Currents Learn About the U.S.

A woman sitting at a computer, typing on the keyboard while looking at the monitor.
Women
  1. Introduction of Female Suffrage
  2. Tokuju (Special Order) Boom and Female Workers
  3. Increase of Female Employees
  4. Popularity of American Style Fashion and Western Dressmaking
  5. Part-time Female Workers
  6. Women and Agriculture
  7. Ama (Female Diver)
  8. Marriage Retirement and Retirement Ages for Men and Women
  9. Office Ladies (OL)
  10. Dual Tracks in Female Occupations: Ippan Shoku (Non-Career Track) and Sōgō Shoku (Career Track)
  11. Laws Regarding Working Women
  12. Sexual Harassment
  13. Low Birth Rate and Working Women
  14. Separate Surnames for Married Couples
  15. Female dominant occupations
  16. “Mighty” Women: Police and the Military Self Defense Force
Listen in English English | Japanese Japanese View Article in English | Japanese
A group of women in kimono walking down a hallway
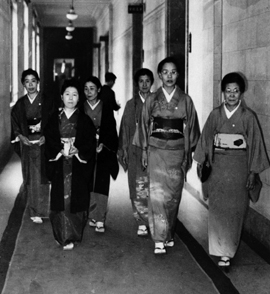
The first female Diet members, 1946.
Photo from Mainichi Shimbun.
Introduction of Female Suffrage
The Allied Occupation of Japan listed “Liberation of Women” as one of its reforms, and the 1947 post-war Constitution of Japan clearly the provided for equality of gender. Women voted for the first time in the 1946 House of Representatives (Shūgiin) election, and 39 female members were elected. In 1947 the Women’s and Children’s Bureau was established in the Ministry of Labor, and Kikue Yamakawa served as its first director. Later, in 1949, the first female judge and prosecutor were appointed, and they became the forerunners of female participants in the political and judicial world.The proportion of women in the Diet, which remained around 3% between the 1950s and 1980s, increased to 6% in 1990 and exceeded 10% in 2001. While these figures indicate that female participation is growing in Japan’s national politics, it also shows that Japan’s Diet is still predominantly male. The House of Councillors has a higher proportion of female members (15%) than the House of Representatives (8%), as of 2002.Click CHART to see the changes over time in the proportion of female members in the Diet.
Special Terms: liberation of women  |  House of Councillors  |  House of Representatives  |  Diet

Download Podcast in English | Japanese
Document | Audio-Video | Chart | Picture | Map